
A share price tells you how much a stock currently costs. However, it does not show how that price compares with the company’s earnings. The price-to-earnings ratio, or P/E ratio, helps make this comparison. This article covers PE ratio meaning, its formula, the different types of P/E ratios and the factors that can affect its interpretation. It also explains how the ratio may be used when looking at individual stocks and equity mutual fund portfolios.
What is PE ratio?
What is PE ratio? It is a valuation multiple that compares a company’s current share price with its earnings per share. Depending on the type of P/E being used, the earnings may be based on the previous 12 months or an estimate of future earnings.
The ratio shows how much the market is currently willing to pay for each rupee of a company’s earnings. However, it does not independently establish whether a stock is overvalued or undervalued. The company’s potential growth, earnings quality, industry, financial position and historical valuation also matter.
P/E ratio formula
The P/E ratio formula is:
For a simplified calculation, EPS can be represented as:
Where:
- Current market price per share: The price at which the share is currently trading.
- Earnings per share: The portion of the company’s profit attributable to each equity share.
Published P/E figures may use basic or diluted EPS and trailing or projected earnings. Therefore, P/E values shown by different financial platforms may vary slightly. When comparing two figures, it is important to check whether they use the same earnings basis.
How to calculate PE ratio: Step-by-step example
The following example shows how to calculate PE ratio using the share price and EPS of a hypothetical company.
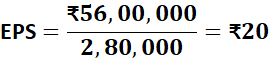
Suppose the shares of XYZ Ltd. are trading at ₹800. The company reported a profit attributable to equity shareholders of ₹56,00,000 and had 2,80,000 weighted-average equity shares during the year.
1. Note the market price per share
The current market price of one share is ₹800.
2. Calculate EPS
The company’s EPS is ₹20.
3. Apply the P/E ratio formula
A P/E ratio of 40 means the share is trading at 40 times its earnings. In other words, its market price represents ₹40 for every ₹1 of EPS.
This figure may be compared with:
- The P/E ratios of similar companies in the same industry
- The company’s historical P/E range
- A relevant industry or market benchmark
- The company’s potential earnings growth and financial position
A P/E of 40 does not, on its own, establish that the share is overvalued or reasonably valued. Its interpretation requires additional context.
The figures shown are for illustrative purpose only
Why does the P/E ratio matter?
The P/E ratio places a company’s share price in the context of its earnings. It may be useful for:
- Comparing the valuations of broadly similar companies
- Comparing a company’s current valuation with its historical range
- Assessing the expectations reflected in the market price
- Comparing a stock or portfolio with a relevant benchmark
- Identifying areas that may require further financial analysis
However, the P/E ratio does not directly measure business quality, investment risk or potential return. It is better treated as a starting point for valuation analysis rather than a final conclusion.
Types of PE ratio
The two commonly used types of P/E ratio are trailing P/E and forward P/E. The main difference lies in whether the calculation uses previously reported earnings or estimates of future earnings.
Trailing Twelve Months (TTM) PE ratio
The Trailing Twelve Months or TTM P/E ratio divides the current market price per share by the company’s reported EPS over the most recent 12 months.
Because it uses actual reported earnings, it provides a historical view of valuation. However, the figure may be affected by one-time gains or losses, changing business conditions and cyclical earnings. It is also backward-looking and may not reflect recent changes in the company’s outlook.
Forward PE ratio
The forward P/E ratio divides the current market price per share by estimated EPS for a future period, commonly the next 12 months.
It shows how the share is valued in relation to expected earnings. However, the calculation depends on forecasts, which may change as business conditions and analyst estimates are updated. Forward P/E figures may also differ between data providers.
Neither trailing nor forward P/E is universally more suitable. They offer different perspectives and may be considered together.
Difference between absolute PE and relative PE ratio
An absolute P/E presents the company’s valuation on its own, while a relative P/E compares it with a selected benchmark.
| Basis | Absolute P/E ratio | Relative P/E ratio |
| Meaning | The company’s P/E ratio viewed independently | The company’s P/E compared with a benchmark, such as its historical average, industry P/E or market P/E |
| Calculation | Market price per share / EPS | Company P/E / benchmark P/E |
| Example | A P/E of 20 means the share trades at 20 times its earnings | A relative P/E of 0.80, or 80%, means the company’s P/E is 20% below the selected benchmark |
| Use | Provides a standalone valuation snapshot | Places the valuation in a historical or peer-based context |
| Limitation | Does not show whether the ratio is high or low relative to an appropriate comparison | The result depends on the benchmark selected and does not establish that the stock is undervalued or overvalued |
A relative P/E above 100% means the company’s P/E is above the selected benchmark. It does not mean that the company has outperformed the benchmark.
What is considered a suitable price-to-earnings ratio?
There is no single P/E ratio that can be considered suitable for every company. What appears reasonable depends on the company’s industry, stage of development, potential earnings growth, financial position and prevailing market conditions.
Different industries tend to trade within different valuation ranges. Industries with higher potential growth may trade at higher P/E ratios, while mature or cyclical industries may trade at lower multiples. Comparing companies from unrelated industries can therefore lead to misleading conclusions.
It may be useful to compare a company’s current P/E with:
- Similar companies in the same industry
- The company’s historical valuation range
- A relevant sector or market index
- Its potential earnings growth
- Its debt, cash flow and profitability
A P/E above the company’s historical range may reflect elevated expectations. A P/E below its usual range may reflect cautious sentiment, slower potential growth or business challenges. Neither interpretation is definitive.
Relationship between P/E ratio and value investing
Value investing involves looking for securities that appear to trade below an estimate of their intrinsic value. The P/E ratio may support this analysis by showing how much the market is paying for the company’s earnings.
However, a low P/E is not automatically evidence of undervaluation. It may reflect slower potential growth, high debt, weakening business conditions, temporary earnings or profits near the peak of an industry cycle. Such situations can create a value trap, where a share appears inexpensive but its underlying challenges remain.
Similarly, a high P/E does not automatically rule out potential value. It may reflect expectations of higher potential earnings growth or relatively consistent profitability.
For this reason, the P/E ratio may be considered alongside cash flows, balance-sheet strength, earnings quality, industry conditions and other valuation measures. It should not be treated as a standalone stock-selection method.
Factors influencing the P/E ratio
Several company-specific and market-wide factors can affect a stock’s P/E ratio:
- Potential earnings growth: Companies expected to record higher potential earnings growth may trade at higher valuation multiples. These expectations may not always materialise.
- Earnings quality and stability: Recurring and relatively stable earnings may be valued differently from volatile profits or earnings driven by one-time gains.
- Industry and business model: Growth rates, capital requirements and business cycles vary across industries, leading to different valuation ranges.
- Interest rates and perceived risk: Changes in interest rates and the returns expected by market participants can influence how much they are willing to pay for future earnings.
- Market sentiment: Optimism or caution may push valuation multiples above or below their longer-term ranges.
- Changes in EPS or share count: Profit movements, exceptional items and share buybacks can change EPS and, consequently, the P/E ratio.
Limitations of the P/E ratio
Although the P/E ratio is widely used, it has several limitations:
- It is generally not meaningful when a company has zero or negative earnings.
- EPS may be affected by accounting policies, one-time items and changes in the number of shares.
- The ratio does not directly account for debt, cash holdings or differences in capital structure.
- Companies in different industries may have very different valuation ranges.
- Cyclical companies can appear to have low P/E ratios when their earnings are near a peak.
- Share prices change continuously, while reported earnings are updated periodically.
- Forward P/E depends on estimates that may change or prove inaccurate.
- A high or low P/E does not predict future share-price performance.
- The ratio does not capture qualitative factors such as management capability, competitive position or regulatory risks.
These limitations make it important to interpret the P/E ratio alongside other financial and business indicators.
What is the P/E ratio in mutual funds and why does it matter?
A mutual fund does not have earnings per unit in the same way that a company has earnings per share. The portfolio P/E displayed for an equity fund is an aggregate valuation measure derived from the shares held in its portfolio.
It is not universally calculated as a simple arithmetic weighted average of every stock’s P/E ratio. Depending on the methodology, the figure may be calculated by dividing the portfolio’s aggregate market value by aggregate earnings or through an equivalent weighted harmonic approach. The treatment of companies with negative earnings, missing data and unusually high ratios can also differ between data providers.
This is why the reported portfolio P/E for the same fund may vary across factsheets and financial platforms. Cash, debt instruments and other holdings without an applicable equity P/E may also be excluded from the calculation.
A higher portfolio P/E means the fund’s equity holdings are collectively priced at higher multiples of earnings. It may reflect the fund’s sector allocation, investment style or expectations of potential earnings growth. A lower portfolio P/E may reflect a value-oriented portfolio, but it could also arise from exposure to slower-growing, cyclical or financially challenged businesses.
For a consistent comparison, a fund’s portfolio P/E may be compared with a relevant benchmark or similar funds using figures from the same date and data source. It should not be used as the sole basis for selecting a mutual fund.
Using the P/E ratio with other measures when evaluating mutual funds
Portfolio P/E offers one view of an equity fund’s valuation. The following measures can add further context:
| Measure | What it may help assess |
| Price-to-book or P/B ratio | How the underlying companies are valued relative to their net assets |
| Earnings growth and PEG ratio | Whether valuations are supported by expectations of potential earnings growth |
| ROE and ROCE | How efficiently the underlying companies use equity or capital to generate earnings |
| Debt and cash-flow measures | The financial position and earnings quality of portfolio companies |
| Sector and market-cap allocation | Whether the portfolio P/E is being influenced by exposure to particular market segments |
| Benchmark and category comparison | Whether the fund’s valuation differs meaningfully from broadly comparable portfolios |
For a broader evaluation, investors may also consider the scheme’s investment objective, portfolio composition, risk measures, expenses and historical performance. Past performance may or may not be sustained in future.
Conclusion
The price-to-earnings ratio shows how a company’s share price compares with its earnings per share. It can provide a quick valuation snapshot, but no single P/E figure can establish whether a stock or portfolio is suitably valued.
The ratio becomes more meaningful when compared with relevant industry peers, historical valuations and suitable benchmarks. Earnings quality, potential growth, debt, cash flow, industry conditions and other valuation measures also need to be considered.
FAQs
What is the PE ratio in the share market?
The P/E ratio in the share market compares a company’s current market price per share with its earnings per share. A P/E of 20 means the share is trading at 20 times its earnings. It is a valuation multiple, not an estimate of potential return.
How to calculate the PE ratio?
Divide the current market price per share by the company’s earnings per share:
For meaningful comparisons, check whether the calculation uses trailing or projected EPS.
What does a high or low P/E ratio indicate?
A high P/E means the market is paying more for each rupee of earnings. It may reflect expectations of higher potential earnings growth or an elevated valuation. A low P/E may reflect lower expectations, business concerns, cyclical earnings or potential undervaluation. Neither conclusion is automatic.
Is a lower P/E ratio always better?
No. A low P/E may indicate a lower valuation, but it can also reflect weak potential growth, high financial risk or business challenges. The ratio needs to be considered alongside comparable companies, historical valuations and the quality of the company’s earnings.
How should a PE ratio of 40 be interpreted?
A P/E ratio of 40 means the share is trading at 40 times its earnings. Whether this is relatively high depends on the company’s industry, historical P/E, potential earnings growth, financial position and comparable companies. The number alone cannot establish whether the valuation is reasonable.
Is a negative PE ratio meaningful?
A negative P/E generally means the company has reported a loss. Because the relationship between price and negative earnings is not economically useful for valuation, many data platforms display the P/E as “N/A”. Other financial measures may provide more context for a loss-making company.
Trailing vs forward PE: Which one is more suitable?
Neither is universally more suitable. Trailing P/E uses reported earnings from the previous 12 months, while forward P/E uses estimated future earnings. Trailing P/E is backward-looking, whereas forward P/E depends on forecasts that may change.
What should be considered apart from the PE ratio?
Factors such as potential earnings growth, cash flow, debt, profitability, competitive position, management capability and industry conditions may also be considered. Other measures, including P/B, PEG and EV/EBITDA, can provide additional valuation context.


































