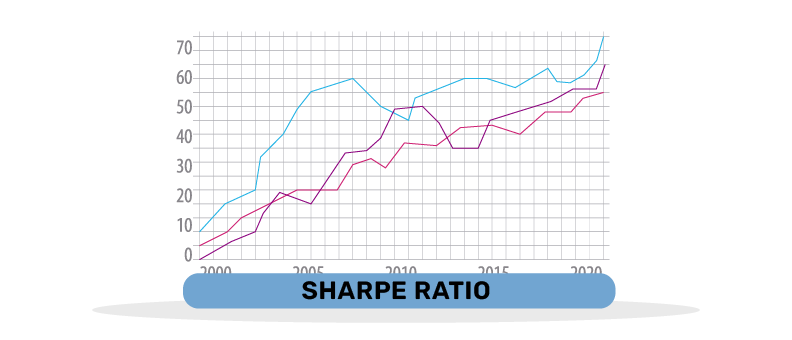
The Sharpe ratio measures how much return an investment earned above a reference rate compared with how much its returns fluctuated. It helps you look beyond returns alone when comparing mutual funds.
For example, two funds may earn similar returns, but one may experience much larger ups and downs. The Sharpe ratio puts those returns in context. It describes performance over the period measured, rather than predicting what you will earn next.
Source: NISM, Mutual fund FAQs.
Table of Contents
Sharpe ratio formula
The historical Sharpe ratio formula is:
Sharpe ratio=Average excess return /Standard deviation of excess returns
Excess return is the fund’s return minus the risk-free return for the same period. Standard deviation measures how widely those returns fluctuate around their average.
When the risk-free rate is constant across the observations, the formula can also be written as:
Sharpe ratio=(Average fund return – Risk-free rate)/Standard deviation of fund returns
Here is what the components mean:
- Average fund return: The arithmetic average of returns recorded at regular intervals, such as monthly or yearly.
- Risk-free rate: The reference return used as a low-risk baseline for the calculation.
- Standard deviation: A measure of how much returns vary, with a larger figure indicating wider fluctuations.
Use matching periods and consistent units. For example, do not divide a yearly excess return by a monthly standard deviation. The result is a ratio, not a percentage.
Source: William F. Sharpe, The Sharpe Ratio, Stanford University.
Key Takeaways
- The Sharpe ratio compares returns above a reference risk-free rate with the fluctuations in those excess returns.
- A higher positive ratio indicates more excess return per unit of volatility when calculations are comparable.
- The Sharpe ratio formula requires consistent return periods, risk-free rates and calculation methods.
- A negative ratio means the average return was below the reference rate, even if the fund earned a positive return.
- Use the ratio alongside costs, holdings and other risk measures rather than choosing a fund solely by its score.
How to calculate Sharpe ratio: A worked example
Priya, a schoolteacher, is comparing two hypothetical equity mutual funds. Assume the calculations use annual returns over the same period and a constant annual risk-free rate of 6%.
| Measure | Fund A | Fund B |
| Average annual return | 12% | 11% |
| Annual risk-free rate | 6% | 6% |
| Standard deviation of annual returns | 10% | 5% |
| Sharpe ratio | 0.6 | 1 |
Here are the steps to calculate Fund A’s Sharpe ratio:
- Calculate excess return: 12% − 6% = 6 percentage points
- Divide by standard deviation: 6% ÷ 10% = 0.60
Fund A Sharpe ratio=(0.12-0.06)/(0.10)=0.60
For Fund B:
Fund B Sharpe ratio=(0.11-0.06)/(0.05)=1.00
Fund A earned the higher average return, but Fund B had the higher Sharpe ratio because its returns fluctuated less. This comparison does not establish which fund suits Priya’s goals or how either will perform next.
The figures shown are for illustrative purpose only
What is considered a good Sharpe ratio?
There is no single good Sharpe ratio for every fund or market period. Compare similar funds using the same dates and calculation method. Here is what these values mean, assuming standard deviation is greater than zero:
- Below 0: The fund’s average return was below the risk-free rate used in the calculation.
- 0: The fund’s average return equalled the risk-free rate.
- 0.5: Average excess return was half the standard deviation of excess returns.
- 1: Average excess return equalled the standard deviation of excess returns.
- 2: Average excess return was twice the standard deviation of excess returns.
These values explain the calculation; they are not fixed investment grades. A ratio below 1 does not automatically make a fund unsuitable, and a ratio above 2 does not establish that it is safe.
Sources: NISM, Mutual fund FAQs; CFA Institute, Refining the Sharpe Ratio.
How does standard deviation affect the Sharpe ratio?
When average excess return is positive, a lower standard deviation produces a higher Sharpe ratio, with other inputs unchanged. Negative ratios need more care. Greater volatility can make a negative ratio appear higher, or less negative, without improving the investment’s return. Avoid using negative Sharpe ratios alone to rank funds.
Source: CFA Institute, Refining the Sharpe Ratio.
When is Sharpe ratio in mutual funds used?
The Sharpe ratio in mutual funds is used when assessing historical returns alongside volatility. Here are its main uses in fund evaluation:
- Mutual fund comparison: Compare similar schemes, such as large cap funds, using a consistent period and method.
- Risk-adjusted return evaluation: Examine whether higher returns came with proportionately wider fluctuations.
- Portfolio performance assessment: Review a portfolio’s return and volatility together, while also considering its individual holdings and other risks.
The ratio supports an investment assessment; it does not prove fund-manager skill or determine whether an investment matches your risk tolerance.
How to calculate Sharpe ratio in Excel
You can calculate the ratio using a series of regular returns. For this illustration, assume you have 36 monthly fund returns and a constant effective annual risk-free rate of 6%.
Here are the steps to calculate an annualised Sharpe ratio in Excel:
- Enter monthly returns: Put the returns in cells B2:B37, entering percentages as 2%, for example, rather than 2.
- Enter the annual risk-free rate: Put 6% in cell D2.
- Calculate its monthly equivalent: In D3, enter =(1+D2)^(1/12)-1, giving approximately 0.4868%.
- Calculate monthly excess returns: In C2, enter =B2-$D$3 and copy the formula down to C37.
- Calculate the annualised ratio: Use the following formula:
=AVERAGE(C2:C37)/STDEV.P(C2:C37)*SQRT(12)
AVERAGE calculates the mean monthly excess return. STDEV.P calculates its population standard deviation, measuring how widely those excess returns fluctuate.
Multiplying by SQRT(12) gives a conventional annualised estimate, assuming no meaningful correlation between successive monthly excess returns. It is not necessarily identical to calculating the ratio from compounded annual returns.
Match the provider’s data and calculation method when reproducing a factsheet figure. Do not substitute CAGR for average monthly return.
Sources: AMFI, Factsheet standardisation guidelines; Microsoft, STDEV.P; William F. Sharpe, The Sharpe Ratio.
Sharpe ratio vs Sortino ratio vs Treynor ratio
These ratios use different measures of risk, so their numerical values should not be compared as though they were interchangeable:
| Measure | Sharpe ratio | Sortino ratio | Treynor ratio |
| What it assesses | Excess return relative to total volatility | Return above a chosen target relative to downside deviation | Excess return relative to market-related risk |
| Risk measure | Standard deviation of excess returns | Downside deviation, measuring returns falling below the chosen target | Beta, measuring sensitivity to a market benchmark |
| Formula | Average excess return ÷ standard deviation of excess returns | (Average return − target return) ÷ downside deviation | (Average return − risk-free rate) ÷ beta |
| Main limitation | Counts upward and downward fluctuations | Depends on the target and calculation method | Does not capture every risk affecting the portfolio |
Unlike the Sharpe ratio, the Sortino ratio focuses on falling short of a target. That target need not be zero. The Treynor ratio focuses on market sensitivity rather than total volatility.
Sources: CFA Institute, The Sortino Ratio; NISM, Mutual fund FAQs.
Limitations of the Sharpe ratio
Here are the main limitations to consider when using the Sharpe ratio:
- Historical results: A favourable ratio over one period does not establish how a fund will perform next.
- Incomplete risk picture: Return fluctuations alone do not fully describe risks such as difficulty selling investments or sudden credit losses.
- Upward fluctuations count too: Strong positive movements can increase standard deviation, even though investors may welcome those gains.
- Calculation differences: Dates, return frequency, risk-free rates and standard-deviation methods can change the result.
- Short measurement periods: A brief period may leave out difficult market conditions and give an incomplete view.
The ratio can be calculated without assuming returns follow a normal, bell-shaped distribution. However, it may give an incomplete picture when unusually large losses or uneven return patterns matter.
Review the fund’s holdings, costs, investment strategy and other risk measures before deciding whether it suits your goals.
Sources: William F. Sharpe, The Sharpe Ratio; CFA Institute, The Sortino Ratio.
Past performance may or may not be sustained in future
Conclusion
The Sharpe ratio helps you assess a mutual fund’s returns alongside the fluctuations involved in earning them. Use the Sharpe ratio formula with consistent data and compare similar funds over matching periods. Review costs, holdings and other risk measures too, because a higher historical ratio does not guarantee better future returns or make a fund suitable for everyone.
FAQs
Where can I find the Sharpe ratio of a mutual fund?
Look in the scheme’s latest factsheet, usually under risk measures or quantitative indicators. Read the accompanying notes for the measurement period, risk-free rate and calculation method. Not every scheme will necessarily publish the measure.
Which risk-free rate is used for Sharpe ratio in India?
AMFI’s factsheet standardisation guidance identifies MIBOR, the Mumbai Interbank Offered Rate, as the reference. Indian fund disclosures may specify FBIL Overnight MIBOR. Other analyses may use a short-term government security return, so check the source’s methodology before comparing ratios.
Can Sharpe ratio be used for SIP investments?
Yes, it can help assess a fund you are considering for a Systematic Investment Plan (SIP). However, it describes the fund’s performance, not your personal SIP return. Your result also depends on the dates and amounts of your investments.
Is 7 a good Sharpe ratio?
A positive Sharpe ratio of 7 means average excess return was seven times its standard deviation on the stated measurement basis. Before drawing conclusions, check the period, annualisation and underlying data. The number alone does not establish safety or future performance.
What happens if standard deviation is zero?
The Sharpe ratio is undefined because its formula would involve dividing by zero. It should not be reported as zero or treated as a valid numerical score.